

The number on the term sheet is not the price
Headline valuations can hide the real economics of a venture deal. Learn how to unpack option pools, deal structures, and market data to find the price actually paid.

By the end of this you will be able to take a headline valuation apart and work out what was actually paid. The arithmetic is shown in full.

An apartment two streets over was listed at $96,000. The buyer paid the $96,000, then the transfer fee, then the parking slot, then a club membership he did not want. The number on the board was real. It was just never the price.
Venture capital does the same thing, with more zeros and better fonts.
In H1 2026, Anthropic raised what was reported as a $65 billion round. PitchBook’s own analysts flagged that roughly $15 billion of it had been committed earlier, so the headline overstated the new money going in. They went further and said something an analyst should tape to the wall: the post-money valuation is usually the highest mark in the round, not the price every investor paid (PitchBook & NVCA, 2026).
If the most scrutinised round on earth is not what its headline says, consider what is happening at seed, where nobody is watching.
What the job actually is
An early-stage analyst is handed a number somebody else chose and asked whether it is defensible.
That is the whole job in one sentence. Not “what is this company worth” — nobody can answer that about a two-year-old company with no revenue. The answerable question is narrower: given this structure, this cap table and this market, what was actually paid, and what would have to be true for that to work out?
Everything below is one worked example, broken and rebuilt three times.

The simple version
Start with the arithmetic every founder learns first. An investor puts in $4 million at a $16 million pre-money valuation.
Reproduce that on paper. It always works, because it cannot fail: post-money is defined as pre-money plus the cheque. It is an identity, like saying a metre is 100 centimetres.
And that is the crack. An identity is not a measurement. The equation is true no matter what number you put in the pre-money slot. It tests nothing.
Break it once: the option pool
Now add the single most common term in an early-stage sheet. The investor asks for a 12% option pool — shares reserved for future employees — and asks for it to be created before the money goes in. Carta’s own explainer is blunt about why: the pool increase is counted in the pre-money share count, so it does not dilute the incoming investor (Carta, n.d.).
Rework it. Post-money is still $20 million. The investor still owns 20%.

So the effective pre-money is $13.6 million. The headline said $16 million. The stated price is 17.6% higher than the price the founders received.
Run the counterfactual to see who moved the money. If the pool were created after the round, everyone would share the dilution: the investor drops to 17.6%, founders to 70.4%. Placing it pre-money shifts 2.4 percentage points from founders to investor. At the $20 million mark, that is $480,000, transferred by a preposition.
Nobody lied. One clause moved, and the number followed.
Break it twice: structure is not ownership
The pool is the beginner’s version. The professional version is optionality.
Damodaran worked this example in 2016, and while the post is old the arithmetic has not dated: a company with a true value of $750 million can be structured so an investor pays $50 million rather than $37.5 million for 5%, purely by loading the deal with protections and future rights (Damodaran, 2016). Five percent of $750 million is $37.5 million. The extra $12.5 million buys terms, not equity — but the headline post-money reads $1 billion, a third above the underlying number.
This is why an experienced analyst never compares post-money valuations across deals. Post-money is a mixture of price and insurance, and the mix is different in every round. The comparable unit is price per share on a fully diluted basis, with the preference stack priced separately.

What practitioners actually do
Three corrections, in the order they matter.
One: they split the comp set before they use it. A “median Series A” is now almost meaningless as a single number. PitchBook’s 2026 year-to-date medians put Series A pre-money at $83.0 million for AI companies and $44.0 million for everyone else — nearly double, same stage, same country, same quarter. Median valuation step-ups run 2.2x for AI against 1.6x for non-AI (PitchBook & NVCA, 2026). Benchmark against the wrong half and you are out by 90% before you start.
Two: they age the data before trusting it. This is the correction I had not expected. IVC, which tracks Israeli tech, publishes projected seed figures alongside reported ones, and says plainly why: most information about seed companies surfaces 12 to 24 months after the round closed, so they multiply reported data by a factor to estimate the real level (IVC Research Center, 2025). MAGNiTT made the same point about MENA from the other direction — H1 2026 capital largely reflects deals agreed six to nine months earlier, so the headline lags the market it claims to describe (MAGNiTT, 2026). Your dataset is not a photograph. It is a long-exposure shot of a moving object.
Three: they read deal count separately from deal value. MENA raised $1.35 billion across 214 deals in H1 2026. Funding fell 22% year on year; deal count fell 41%, the weakest half since at least 2022, and the ten largest transactions took 58% of the money (MAGNiTT, 2026; Arab News, 2026). India shows the mirror image: total funding down 9% to $5.2 billion, deal count up 7%, and seed funding up 18% to $478 million on a stable $1 million median ticket (Inc42, 2026). Israel is a third pattern again — $7.6 billion raised in H1 2026, up 52%, on a round count that keeps falling, roughly 100 per quarter since 2023 against about 140 in 2019 to 2020 (Globes, 2026, reporting IVC-LeumiTech).
Three regions, three directions, and in every one the dollar headline and the activity headline disagree.
The edge of the map
Here is where serious people still argue, and I am not going to pretend it is settled.
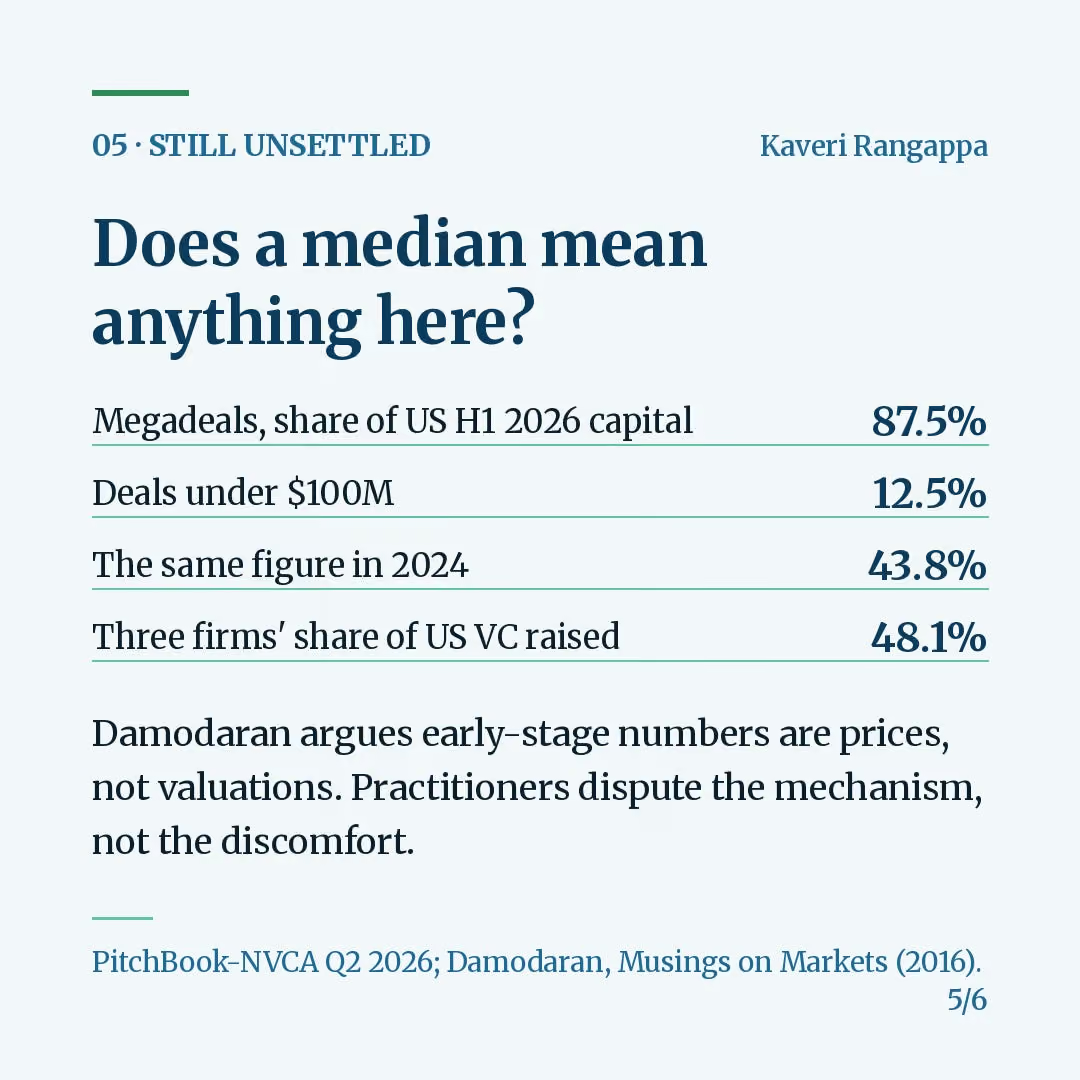
Damodaran’s position is that early-stage numbers are not valuations at all — they are prices, set by mood and momentum, and venture investors are traders rather than investors (Damodaran, 2016). Sajith Pai of Blume Ventures pushed back directly on the mechanism: he has never seen the target-rate-of-return method Damodaran describes used by any early-stage investor he knows (Pai, 2021; a 2021 essay, but the disagreement is live). Both are right about something. The thing being modelled may not be a value, and the model being criticised may not be the one anyone runs.
The second unsettled question is whether medians describe this market at all. Megadeals of $100 million or more took 87.5% of the $412.7 billion deployed in the US in H1 2026. Deals under $100 million took 12.5%, down from 43.8% in 2024. Three firms — Andreessen Horowitz, Thrive Capital and Founders Fund — raised 48.1% of all US venture capital in the half (PitchBook & NVCA, 2026). In a distribution that shaped, the median tells you about a market almost nobody is trading in, and the average tells you about five deals. There is no single honest summary statistic. That is not a gap in the data. It is the shape of the thing.
Where the money actually goes
Follow the cash and the defensibility question answers itself. Founders sell ownership; investors buy optionality; the option pool pays employees who have not been hired; the preference stack decides who gets paid first if the exit is small. Margin sits with whoever controls the terms, not whoever quotes the number. For an analyst, the moat is not access to deals — data platforms have commoditised that. It is the ability to reprice a headline into a fully diluted, structure-adjusted, correctly-benchmarked figure and defend each step.
Why now, what changes, what dies
Why now: the AI premium has broken the single-median comp. When two companies at the same stage price 90% apart on a label, blended benchmarks stop working, and that has only become severe in the last eighteen months.
By 2031: I expect structure-adjusted valuation to become table stakes rather than a specialism, and regional datasets — MAGNiTT, IVC, Inc42, Tracxn — to be read as primary rather than as supplements to US data.
What gets obsolete: the one-line comp. “Median seed post-money is $X” is already a sentence that needs three qualifiers to survive contact with a real deal.
How I worked this out
I got the pool arithmetic wrong on the first pass. I took 12% of the pre-money rather than 12% of the post-money, which gave founders 70.6% and made the effect look smaller than it is. The convention is that the pool is quoted as a percentage of the post-money, fully diluted, and creating it pre-money is what shifts the burden. Redoing it as a counterfactual — pool before versus pool after — was what made the $480,000 visible.
The IVC methodology note was the thing I had to read twice. I assumed the projection factor was smoothing. It is not; it is a correction for information that structurally does not exist yet. The PitchBook Q2 2026 PDF settled the Anthropic question in one paragraph after I had spent too long in news coverage that repeated the headline.
Where I could be wrong
The 17.6% overstatement holds only for a pool created entirely pre-money at 12% of post-money fully diluted. If a deal splits the pool between the parties, or sizes it off the pre-money, the number falls, and my figure is too dramatic. Show me a term sheet where the pool is shared and I will withdraw the framing. Separately, if someone demonstrates that structured terms are rare at seed rather than at growth stage, the Damodaran example is a poor illustration for this stage and I should have anchored it later in the funnel.
What I am still working out
- How to price a liquidation preference at seed without an exit distribution I can defend.
- Whether IVC’s projection factor for seed data has an equivalent for India and MENA, and if not, how much I am under-counting.
- Whether “median” should simply be retired for 2026 venture data in favour of quartile ranges reported separately for AI and non-AI.

Your turn
Rebuild the pool calculation with your own assumptions. If you size it at 10%, or split it, or place it post-money, you get a different answer and I would like to see it. Corrections to the arithmetic are the point of writing this in public.
#VentureFinance #ValuationMath #StartupData #DealAnalysis #CapTableMath #PreMoney #InvestmentAnalysis #FundingTrends
Sources
Arab News. (2026, July 14). Regional conflict drags MENA startup funding down 22%. https://www.arabnews.com/node/2650728/amp
Carta. (n.d.). Option pool definition: How to size your employee option pool. https://carta.com/learn/startups/equity-management/option-pool/
Carta. (2026). The state of seed 2025: Benchmarks for the new era of building. https://carta.com/data/resources/state-of-seed-2025/
Damodaran, A. (2016, October 3). Venture capital: It is a pricing, not a value, game! Musings on Markets. https://aswathdamodaran.blogspot.com/2016/10/venture-capital-it-is-pricing-not-value.html
Globes. (2026, July 2). Israeli tech fundraising up 52% in H1 2026. https://en.globes.co.il/en/article-israeli-tech-fundraising-up-52-in-h1-2026-1001547660
Inc42. (2026, June 30). Indian startup funding slips 9% to $5.2 Bn in H1 2026. https://inc42.com/features/indian-startup-funding-slips-9-to-5-2-bn-in-h1-2026/
Inc42. (2026). Indian tech startup funding report, H1 2026. https://inc42.com/reports/indian-tech-startup-funding-report-h1-2026/
IVC Research Center. (2025). Q4 Israeli tech review 2025. https://www.ivc-online.com/
MAGNiTT. (2026, July). MENA venture capital: The H1 2026 review. https://magnitt.com/research/mena-venture-capital-the-h1-2026-review-51047
Pai, S. (2021, June 13). ‘Exhaust fumes’, or, understanding startup valuations. Medium. https://sajithpai.medium.com/exhaust-fumes-or-understanding-startup-valuations-610897d7bcf8
PitchBook & National Venture Capital Association. (2026, July 8). Q2 2026 PitchBook-NVCA Venture Monitor. https://nvca.org/wp-content/uploads/2026/07/Q2-2026-PitchBook-NVCA-Venture-Monitor.pdf
Glossary
Pre-money valuation — what a company is said to be worth immediately before new money goes in.
Post-money valuation — pre-money plus the amount invested. An arithmetic result, not a measurement.
Dilution — the fall in your ownership percentage when new shares are created.
Option pool (ESOP) — shares set aside for future employees. Where it sits in the arithmetic decides who pays for it.
Fully diluted — a share count that includes options and convertibles as if they already existed. The only basis on which two deals can be compared.
SAFE — a simple agreement for future equity; money now, shares later at the next priced round.
Valuation cap — the maximum valuation at which a SAFE converts, which sets the investor’s floor on ownership.
Liquidation preference — the right to be paid back first, and sometimes several times over, before ordinary shareholders see anything.
Step-up — the ratio between the new round’s pre-money and the previous round’s post-money.
Megadeal — a single financing of $100 million or more.
Down round — a round priced below the previous one.
Deal count vs deal value — how many financings happened, versus how much money moved. They routinely point in opposite directions.
