

How One Growth Number Turns $7.6M Into $30M
A single assumption can dramatically change a company’s valuation—here’s how a small shift in growth can turn $7.6 million into $30 million.

By the end, you’ll build a discounted cash flow by hand and watch it break.
Take a spreadsheet with one future cash flow, one discount rate, and one growth rate. Move the growth rate by five percentage points and watch the model’s output jump from $7.6 million to $30 million. Nothing else changes. Not the business, not the cash, not the year. One number, sitting in the denominator of a formula, decides whether the company is worth roughly the price of a small building or a small stadium. That number is easy to miss, because it looks like the least interesting input in the whole model.
What This Actually Is
A financial model is a set of guesses about tomorrow, arranged into a spreadsheet so they turn into a number today. That’s the whole job. Someone wants to know: what is this cash flow worth right now, or how much cash will this business need next year, or what happens if a customer leaves. The model takes assumptions (growth, cost, timing) and runs them through arithmetic to produce one answer a person can act on. A fifteen-year-old could repeat the definition back like this: a financial model turns “what if” into a number.
The Mechanism
Every model rests on the same handful of moving parts: how fast revenue grows, how much of it survives as profit, how much cash gets tied up in running the business, and how future money gets converted into today’s money (the discount rate). Change any one of these and every number downstream of it moves. The rest of this piece follows two of them, growth and the discount rate, because they interact in a way that quietly does the most damage, and because the arithmetic is short enough to redo on paper.
Fundamentals: The Simple Version
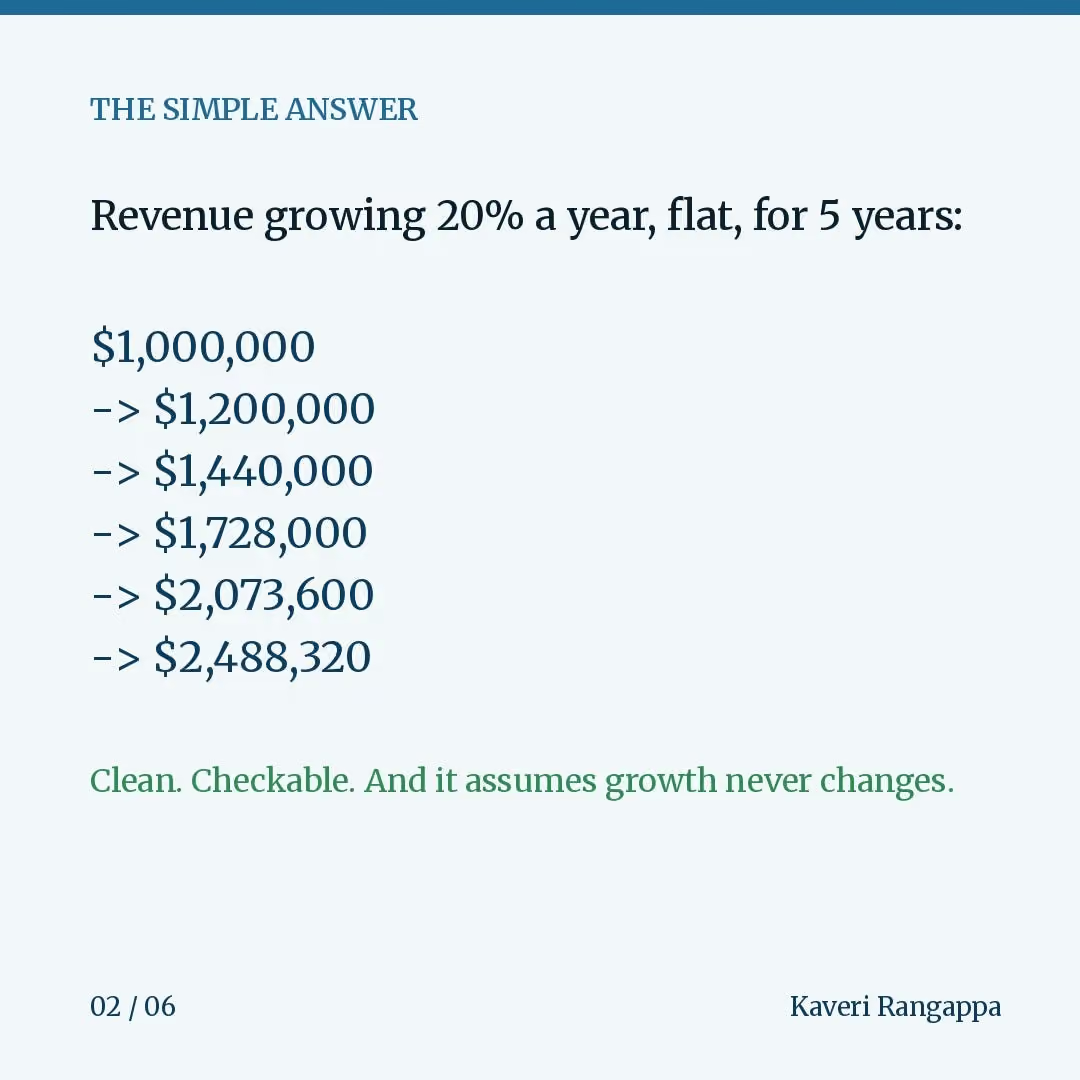
Start with a business earning $1,000,000 in revenue this year, growing at a flat 20% a year. Revenue next year is $1,000,000 x 1.20 = $1,200,000. Run that forward five years:
Year 1: 1,200,000
Year 2: 1,200,000 x 1.20 = 1,440,000
Year 3: 1,440,000 x 1.20 = 1,728,000
Year 4: 1,728,000 x 1.20 = 2,073,600
Year 5: 2,073,600 x 1.20 = 2,488,320
That’s the whole mechanic: multiply by (1 + growth rate), once per year. Five years of 20% growth turns $1 million into about $2.49 million. It’s clean, it’s checkable on a calculator, and it’s what most beginner templates show.
Here’s the crack: this assumes growth stays exactly the same number, every single year, forever. Real businesses don’t grow at a constant rate. They accelerate, then they slow down as the easy customers run out. A flat growth rate isn’t a forecast. It’s a placeholder standing in for a forecast.
Why The Simple Version Isn’t Enough
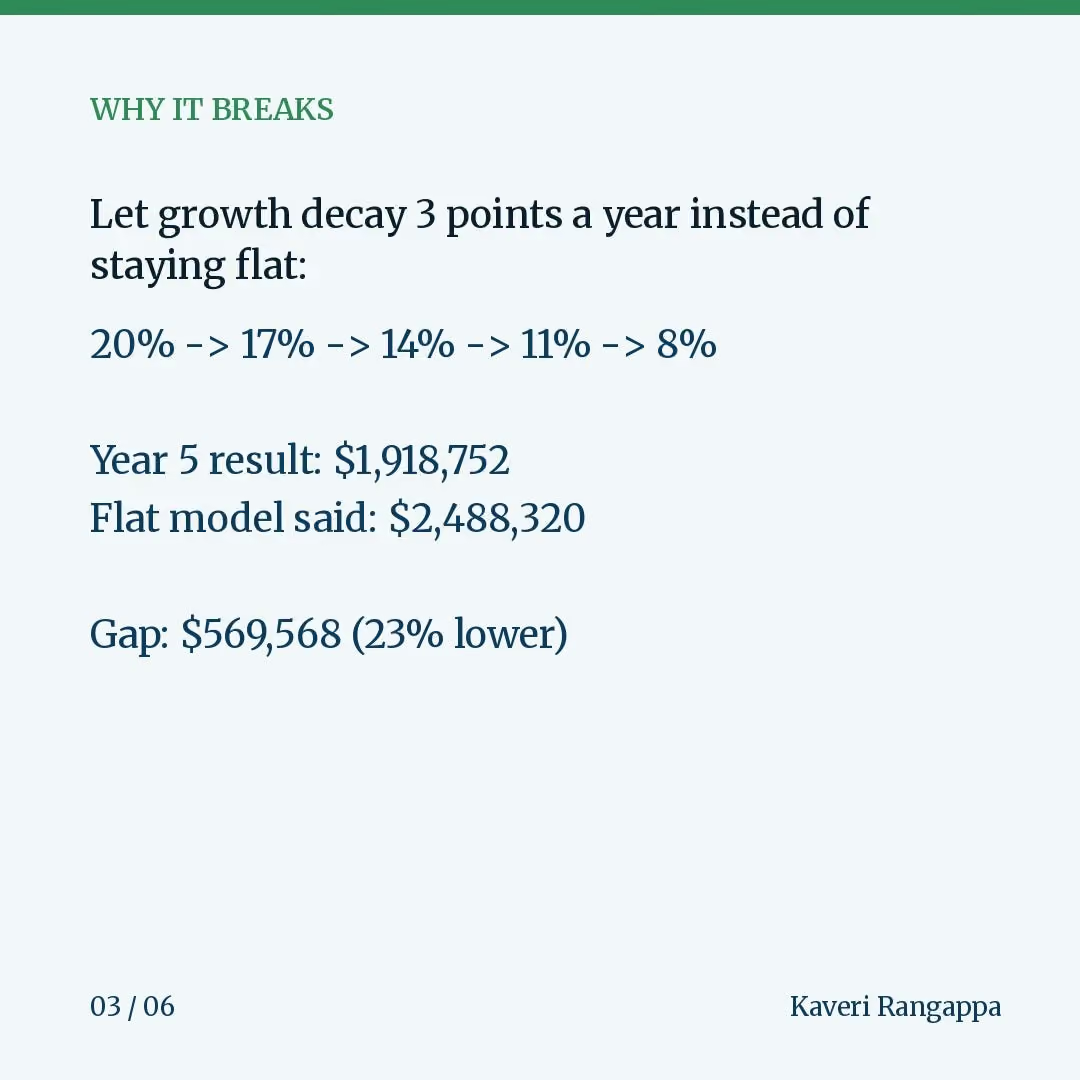
Suppose growth actually decays by 3 points a year: 20%, 17%, 14%, 11%, 8%. Same starting point, same five years:
Year 1: 1,000,000 x 1.20 = 1,200,000
Year 2: 1,200,000 x 1.17 = 1,404,000
Year 3: 1,404,000 x 1.14 = 1,600,560
Year 4: 1,600,560 x 1.11 = 1,776,622
Year 5: 1,776,622 x 1.08 = 1,918,752
The flat model said $2,488,320. The decaying model says $1,918,752. That’s a $569,568 gap, roughly 23% lower, produced entirely by how the growth rate moves over time, not by how big it starts out. The input carrying all the weight here isn’t “the growth rate.” It’s the path of the growth rate, and most beginner models never model a path. They pick one number and drag it across five columns.
What Practitioners Actually Do
This is where the discount rate enters, because a single year’s revenue gap is a rounding error compared to what happens when you use growth to build a terminal value, the number that represents everything a business is worth after the forecast period ends.
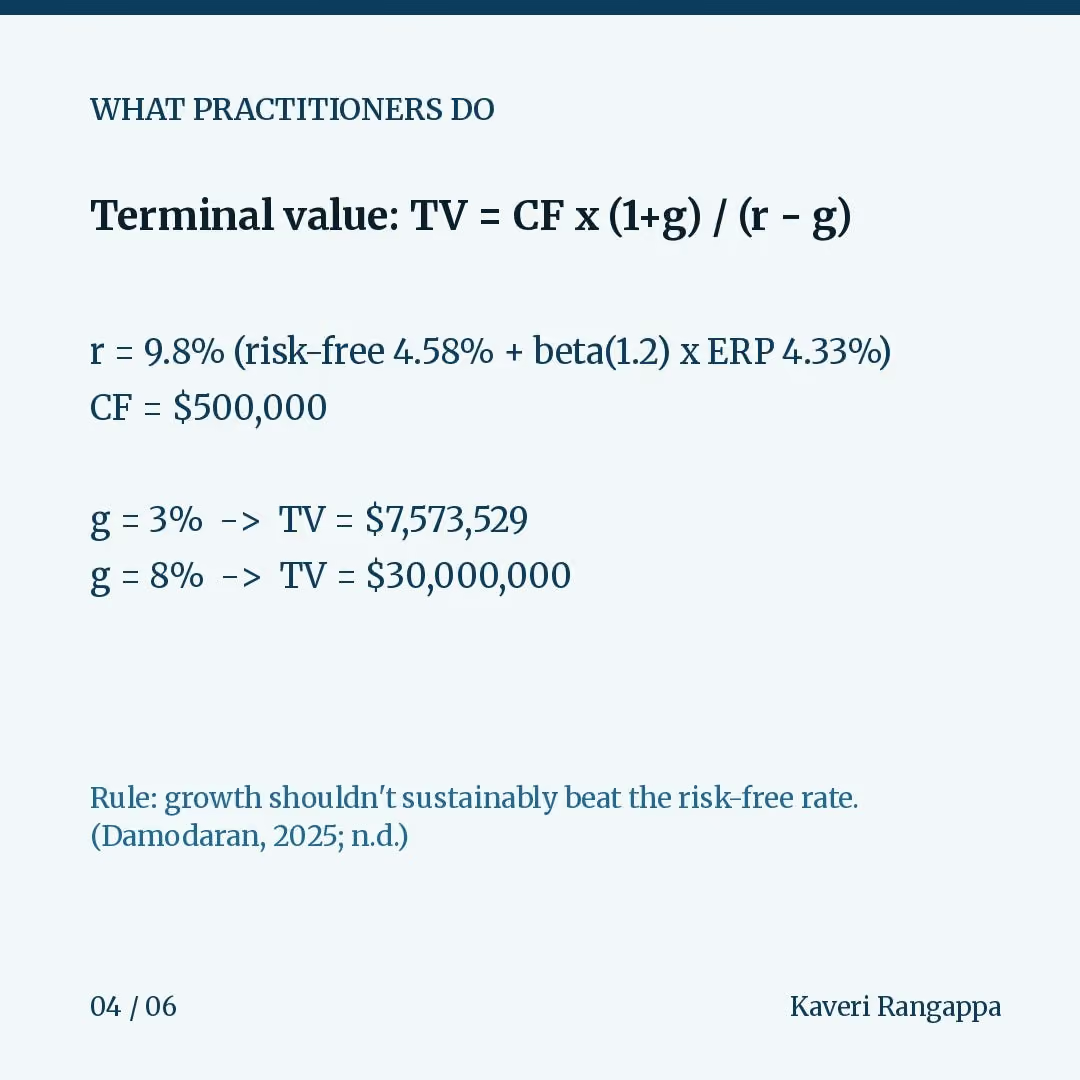
The terminal value formula is: TV = CF x (1 + g) / (r — g), where CF is the last forecast year’s cash flow, g is the long-run growth rate, and r is the discount rate. To get r honestly, you need real inputs, not guesses. Aswath Damodaran’s data update for the start of 2025 put the U.S. ten-year Treasury rate at 4.58% and the implied U.S. equity risk premium at 4.33%, both estimated from actual market prices rather than assumed (Damodaran, 2025). Using cost of equity = risk-free rate + (beta x equity risk premium), and assuming an illustrative beta of 1.2 for a risky, all-equity business: 4.58% + (1.2 x 4.33%) = 9.78%, rounded here to 9.8% for clean arithmetic.
Now plug in a cash flow of $500,000 and a growth rate of 3%, which sits comfortably below the risk-free rate:
TV = 500,000 x 1.03 / (0.098–0.03) = 515,000 / 0.068 = $7,573,529
Damodaran’s own rule of thumb, drawn from decades of valuation teaching, is that a stable growth rate should not exceed the riskless rate used in the discount rate, because no company can outgrow the economy it sits inside forever (Damodaran, n.d.). That 3% respects the rule. Practitioners hold to it not out of habit but because breaking it means assuming infinite outperformance, and infinite outperformance isn’t a forecast, it’s a fantasy with a spreadsheet attached.
Where The Miscalculation Lives
Now watch what happens if an analyst, wanting a rosier number, quietly pushes growth to 8%, above the risk-free rate, and close enough to the discount rate to matter:
TV = 500,000 x 1.08 / (0.098–0.08) = 540,000 / 0.018 = $30,000,000
Same cash flow. Same discount rate. The growth assumption moved 5 points, and the answer moved by 4x. This is the mechanical reason terminal value is the single most dangerous number in a financial model: it sits in a formula where the growth rate shares a denominator with the discount rate, and as the two get close together, that denominator shrinks toward zero and the value explodes. A small, plausible-sounding optimism (8% instead of 3%) produces a wildly implausible output, and because the arithmetic still “works,” it’s easy to miss until someone checks the growth rate against the risk-free rate and asks why it’s higher.
The Edge Of The Map
Here’s where I run out of settled ground. This whole calculation assumes you can observe a beta, a market price, a stream of cash flows. Early-stage and pre-revenue companies have none of these. There is no traded stock to pull a beta from, and often no meaningful cash flow to discount. This is precisely why a real dispute exists in valuation practice: some practitioners still force a DCF onto young companies using scenario-adjusted growth and heavily debated betas, while others abandon discounted cash flow entirely in favor of comparables or venture-style methods that work backward from a target return and an expected exit multiple. Neither side has fully won, and I don’t think the disagreement gets settled by more spreadsheet precision. It’s a disagreement about what a number can honestly claim to represent when the future is this uncertain.
The Five-Year Shift
By 2031, I expect fewer models will present growth and terminal value as single point numbers at all. Cheap computing makes it easy to run a range of growth paths and show a distribution of outcomes instead of one answer. A model that shows only a single terminal value, with no sensitivity table beside it, will likely start to look under-built rather than clean.
Why Now
What’s changed in the last eighteen months isn’t the math, it’s the checking. Spreadsheet-native AI assistants can now flag, in seconds, when a growth assumption sits above a publicly documented risk-free rate, or when a terminal value formula’s denominator has shrunk dangerously close to zero. That kind of sanity check used to require someone senior glancing over your shoulder. Increasingly it doesn’t.
What Gets Obsolete
A model that states its discount rate and growth rate without naming where either came from is going to be harder to defend, because verifying them against public data now takes a search instead of a phone call. “I used 8% because it felt right” stops being a workable sentence once the check is instant.

Your Turn
Redo the arithmetic above with your own numbers. Change the beta, change the growth path, change the cash flow. If you get a different answer than I did, or you think the illustrative beta of 1.2 is wrong for this kind of business, say so in the comments. I’d rather be corrected than agreed with.
Sources
Damodaran, A. (2025, January 18). Data update 2 for 2025: The party continues (for US equities)! Musings on Markets. https://aswathdamodaran.substack.com/p/data-update-2-for-2025-the-party
Damodaran, A. (n.d.). The stable growth rate. NYU Stern School of Business. https://pages.stern.nyu.edu/~adamodar/New_Home_Page/valquestions/stablegrowthrate.htm
Damodaran, A. (n.d.). Terminal value. The Little Book of Valuation. NYU Stern School of Business. https://pages.stern.nyu.edu/adamodar/New_Home_Page/littlebook/terminalvalue.htm
Glossary
Discount rate: the interest rate used to shrink a future dollar down to what it’s worth today, because a dollar later is worth less than a dollar now.
Growth rate (g): the percentage a cash flow or revenue number is assumed to increase each year.
Terminal value: the estimated value of all cash flows a business will produce after the last year anyone bothered to forecast individually.
Cost of equity: the return an investor in a company’s stock requires to compensate for the risk of holding it.
Risk-free rate: the return on an investment with essentially no risk of default, usually a government bond.
Equity risk premium (ERP): the extra return investors demand for holding stocks instead of a risk-free bond.
Beta: a number describing how much a company’s stock tends to move relative to the overall market; a beta above 1 means it tends to move more than the market.
WACC (weighted average cost of capital): the blended cost of a company’s equity and debt financing, used as the discount rate when a company uses both.
DCF (discounted cash flow): a valuation method that adds up a business’s future cash flows, each shrunk to today’s value using a discount rate.
Comparables (comps): valuing a company by comparing it to similar companies whose prices are already known.
#FinModel #DCFValuation #StartupFinance #ValuationMethods #CapTable #VentureFinance #FinanceExplained #LearnInPublic
